Between Bushfires and Floods
Background
During the last decades, the coastal area of the south-eastern Australian province New South Wales has experienced significant flooding and bushfires. The satellite map shows both types of natural disasters in the area near the mouth of the Manning River.
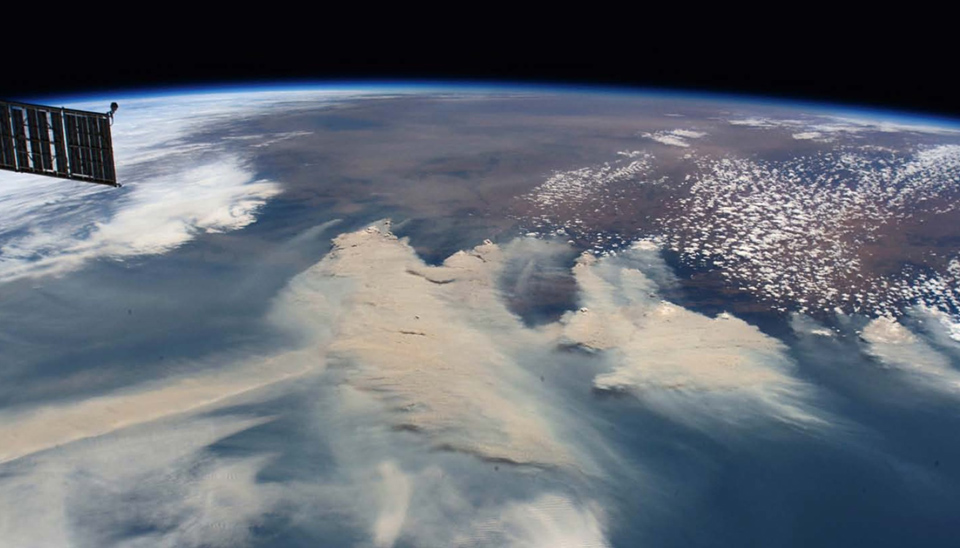 Starting in 2019, the area experienced a series of devastating bushfires that burned large areas of forest and grassland. These fires were exacerbated by a drought and high temperatures, which created ideal conditions for fires to spread rapidly. The fires destroyed buildings and natural habitats, and caused widespread air pollution, with many residents forced to evacuate their homes for weeks at a time. The bushfires in 2019 and 2020 burned through an estimated 5.5 million hectares of land, destroyed over 2,400 homes, and caused the loss of an estimated 1.25 billion animals.
Following the bushfires, the region experienced a period of heavy rainfall that led to severe flooding. The flooding caused extensive damage to homes and infrastructure, including roads and bridges. It also caused significant environmental damage, with many areas of land and waterways affected by debris and sediment.
With respect to economic impact, the Insurance Council of Australia estimated that insured losses from the bushfires in the state of New South Wales alone exceeded Euro 1.5 billion. The cost of the floods that followed in 2021 was estimated to be around Euro 150 million, with over 3,000 people evacuated and many homes and businesses damaged or destroyed.
The environmental impact of these events has also been significant. A large amount of habitat and wildlife was destroyed or severely impacted by the bushfires and floods. In particular, the endangered koala population in the area was significantly affected by the fires, with an estimated 30% of their habitat lost. The floods also affected water quality, with debris and sediment washed into the river system, affecting local ecosystems and aquatic life.
Exercises
- Satellite Map:
- Select the false colour infrared satellite image of January 2019 only. Describe the structures and try to identify the land use (forests, agricultural land, water bodies, settlements).
- In which colours do these areas appear in this false colour infrared representation? How is the intensity of vegetation represented in this representation?
- Now add the satellite image from November 2019. What can you see here? Why do areas along the coast appear in grey?
- Try to estimate the burnt area.
- Now add the satellite image from March 2021. What has changed? What are the dark patches around the rivers? Compare the flooded areas in this image with the burnt areas in November 2019.
- What has happened to the burnt areas between November 2019 and March 2021? Why are they hardly visible anymore?
- EO Browser:
- Open the EO Browser.
- Search for the most recent usable Sentinel-2 dataset covering the area of the satellite map.
- Use a false colour infrared representation comparable to that in the satellite map and compare.
- Can you identify differences?
- Do the satellite images show seasonal changes and, if so, what changes? Hint: when do we have summer on the southern hemisphere?
Sources and Links
Links:
|