Solar power in India
Background
The Bhadla Solar Park located in the Thar Desert in Rajasthan, India, is one of the largest solar power plants in the world, providing a total capacity of 2245 megawatts (MW). The project is located near the village of Bhadla, which is situated about 200 kilometers northeast of the city of Jodhpur.
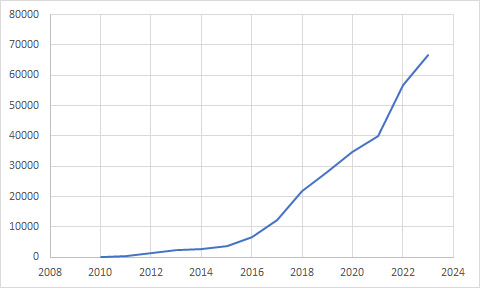 Diagram: Development of the total installed photovoltaic capacity in India (in Megawatts).
The project was launched in 2015 as part of the Indian government’s plan to increase the country’s renewable energy capacity. The aim of this plan is to reduce India’s dependence on fossil fuels, which are a major contributor to air pollution and greenhouse gas emissions.
The project was implemented by the state-owned National Thermal Power Corporation (NTPC) and is spread over an area of 57 square kilometers. The plant uses both photovoltaic and concentrated solar power technologies to generate electricity. The photovoltaic panels cover an area of more than 40 km², while the remaining area is used for concentrated solar power technology. The Bhadla Solar Power Plant generates electricity to power about 1.3 million homes and reduces carbon emissions by about 4 million tons per year.
The sequence of satellite images gives an impression, how quickly this huge power plant was installed.
Exercises
- Satellite Map:
- Look at the satellite image maps and click on the layer selector in the upper right. Deselect all satellite images except the one from 2013. Can you identify any traces of solar power plants?
- Using the layer selector, add the newer satellite images one by one.
- What can you see in the satellite images? Describe the surface structures visible in the different images.
- Describe the different landcover and landuse visible in the satellite images. Identify natural and man-made structures in the images. Describe changes in the agricultural area.
- Describe the progress of the power plant construction. In which years was the growth of the solar power plant largest? Does this agree with the diagram above?
- Can you identify advantages and disadvantages of the location of the solar power plant in a desert environment?
- Look at the satellite data from 2016 and 2018 and compare the data quality. Zoom in to the maximum reasonable scale. Which differences can you see between the datasets?
- EO Browser:
- Open the EO Browser.
- Find the most recent Sentinel-2 dataset covering the area of the Satellite Map.
- Display the dataset using true colours and compare with the Satellite Map. Can you identify recent changes? If so, are there changes related to the solar power station?
Links and Sources
| Links: |