Nuclear power plant in Northern Europe
Background
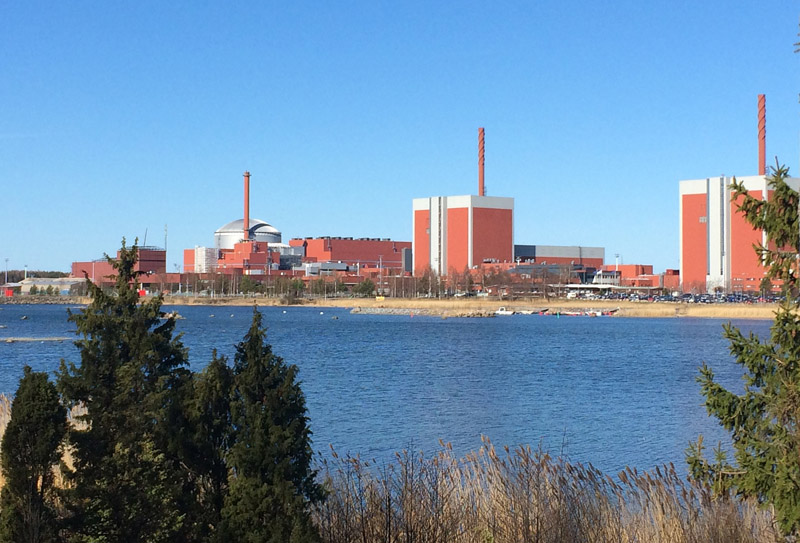
In 1973 Finland started an ambitious project to exploit the power of nuclear energy for a sustainable future. The Olkiluoto Nuclear Power Plant, located at the west coast of the country on an island in the Gulf of Bothnia, emerged as a significant milestone in this endeavour. Over the years, the development of Olkiluoto has brought about notable changes to the coastal landscape, all closely monitored through satellite images.
Initially, Olkiluoto was a sparsely populated island with a picturesque coastline. The construction of the three reactors of the nuclear plant necessitated extensive land reclamation of approximately 150 hectares, transforming the shoreline and surrounding areas. Satellite images have captured the expansion of the plant, the construction of cooling water channels, and the growth of infrastructure. While the construction of a fourth reactor has been stopped, the Onkalo spent nuclear fuel repository is currently being constructed only 2 km east of the power plant.
 The Olkiluoto Nuclear Power Plant has become an important source of electricity. With three operational reactors, the facility has a total installed capacity of 3,380 megawatts. In 2021 a total of 14.4 TWh of the 83 TWh electric energy consumed in Finland was produced. The reliable and clean energy produced here significantly reduces the nation’s carbon footprint and reliance on fossil fuels, contributing to a more sustainable energy mix.
Exercises
- Satellite Map:
- Look at the satellite image maps and switch the image from 2017 on and off. Describe the changes between 2011 and 2017. Where are the modifications of the landscape most prominent? Zoom in to the site of the nuclear power plant at the end of the peninsula left to the image center.
- Where can you find hints for energy production and distribution infrastructure?
- How could they affect the people living there?
- Describe the land use types you can see in the region.
- EO Browser:
- Open the EO Browser.
- Find the most recent Sentinel-2 dataset covering the area displayed in the satellite map. Is it easy to find (more or less) cloud-free images? Why/why not?
- Select a true colour visualisation.
- Can you identify additional, recent changes in the area (check e.g. forests and agricultural land)?
- Compare with the Satellite Map. Can you identify additional substantial changes?
- Select the false colour infrared representation. Can you identify the land-use of the most intensely vegetated areas (represented by bright red colours)?
Links and Sources
 Download PDF document of the case study
Links: