Water supply in California
Background
Lake Oroville Reservoir, located in Northern California’s foothills, spans approximately 62 square kilometres, and has a maximum capacity of around 4.3 cubic kilometres of water when filled to the brim. Satellite images offer a striking view of its vast expanse and its network of tributaries and allow for monitoring both its filling status and its water quality.
Agriculture in the surrounding region heavily depends on Lake Oroville’s water supply, with approximately 2800 square kilometres of farmland benefiting from irrigation sourced from the reservoir. This plays a significant role in California’s agricultural sector, which is responsible for producing over 50 billion Euro worth of crops annually.
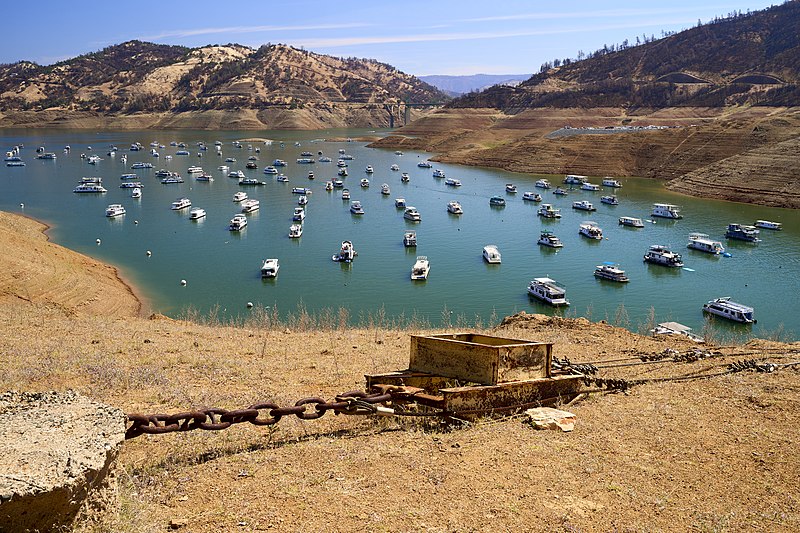 Climate change poses a increasing challenge. While large changes in the water level have been relatively common, rising temperatures and altered precipitation patterns have led to prolonged droughts, causing the reservoir’s water levels to plummet. In recent years, Lake Oroville has experienced alarming drops, with water levels decreasing by up to 60 metres in some instances. In this context, spring 2023 was special as intense rainfall filled the reservoir, thus pausing the drought.
To combat the impacts of climate change, meticulous conservation and water management strategies are imperative. Lake Oroville’s fate underscores the urgent need for sustainable practices and climate resilience measures in managing our precious water resources.
Exercises
- Satellite Map:
- Look at the satellite image maps and click on the layer selector in the upper right. Deselect all layers by unticking the respective boxes.
- The Open Streetmap (OSM) map remains. Which land cover classes can you identify?
- Add the satellite image from 2021 and zoom in. Which land cover classes can you identify? Look at the barren, grey area east of the lake. Can you imagine, why this region is not vegetated as the OSM indicates? (The area was affected by the North Complex Fire in 2020).
- Toggle between the satellite images from 2021 and 2023. Which changes in the landscape are most prominent?
- Focus on the water surfaces, which changes can you identify?
- Add the layer “Waterbodies” derived from the satellite data and estimate the proportional change of the water surface.
- EO Browser:
- Open the EO Browser.
- Find the most recent Sentinel-2 dataset covering the area displayed in the satellite map.
- Select a true colour visualisation.
- Can you identify additional, recent changes in the area (check e.g. water surfaces)?
- Select the false colour infrared representation. Can you identify the land-use of the most intensely vegetated areas (represented by bright red colours)? Are still traces of the 2020 North Complex Fire east of the lake visible?
Links and Sources
| Links: |