Hydropower in the Amazon Basin
Background
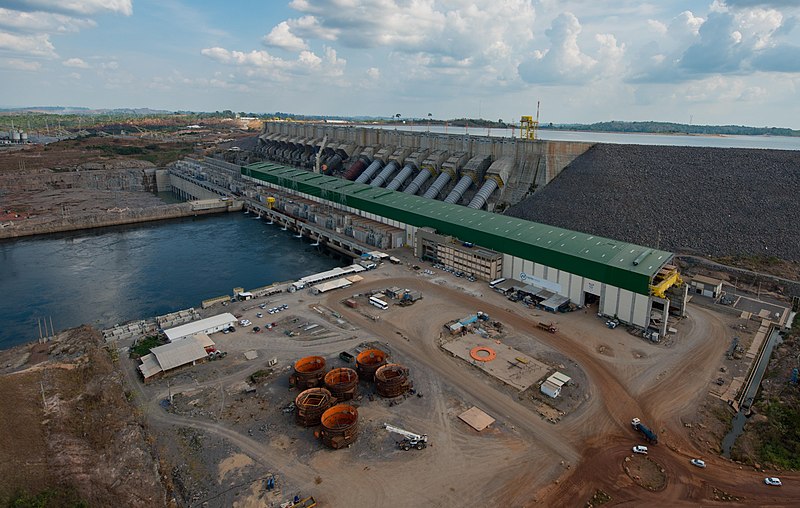
The Belo Monte Power Station, located in Brazil’s northern state of Pará, is one of the largest hydroelectric power plants in the world. Its construction began in 2011 and was completed in 2019. The power station is using the energy of the Xingu River, a major tributary of the Amazon River.
The total installed capacity of more than 11,000 megawatts (MW) is enough to supply electricity to over 60 million people. The power station has 18 power generating units, each with a capacity of 611 MW. It is estimated that the power station will produce around 40,000 GWh of electricity per year, which will help to meet the growing demand for electricity in Brazil.
 The construction of the dam has been controversial. Environmentalists and indigenous groups have raised concerns about the impact of the power station on the local ecosystem and on the livelihoods of the indigenous people in the area. The construction of the power station involved the flooding of a large area of forest and the displacement of thousands of people. Moreover, the changed water regime has impacted the ecosystem of Rio Xingu below the dam.
Despite these concerns, the Brazilian government has defended the construction of the Belo Monte Power Station as necessary to meet the country’s energy needs, to promote economic development, and to reduce Brazil’s dependence on fossil fuels and by that to help combat climate change.
The datasets provided in the satellite map comprise satellite image data from 2011, 2015 and 2017 as well as the extents of the water bodies derived from the satellite images of 2015 and 2017.
Exercises
- Satellite Map:
- Look at the satellite image maps and click on the layer selector in the upper right. Deselect the layer groups “Water bodies” and “Satellite” by unticking the respective boxes.
- The Open Streetmap (OSM) map remains. Which land cover classes can you identify?
- Add the satellite image from 2011 (lowest in the list) and zoom in. Which land cover classes can you identify?
- Toggle between the satellite images from 2011 and 2017. Where are the modifications of the landscape most prominent?
- Where can you find an increase of the water area, where a decrease?
- Compare this with the layers “Water bodies” in 2015 and 2017.
- How can these changes influence the wildlife in this region?
- How do they affect the people living there?
- Describe the land use types you can see in the region. Is only natural land flooded by the dam?
- EO Browser:
- Open the EO Browser.
- Find the most recent Sentinel-2 dataset covering the area displayed in the satellite map. Is it easy to find (more or less) cloud-free images? Why/why not?
- Select a true colour visualisation.
- Can you identify additional, recent changes in the area (check e.g. forests and agricultural land)?
- Compare with the Satellite Map. Can you identify additional substantial changes?
- Select the false colour infrared representation. Can you identify the land-use of the most intensely vegetated areas (represented by bright red colours)?
Links and Sources
Links:
|