Quickly growing desert city with water issues
Background
Las Vegas was founded in 1905, when the construction of a railway connection between Los Angeles and Salt Lake City crossed the area. The city is located in the Mojave Desert in Nevada, United States.
While it remained a small village in the beginning, the development of Las Vegas gained speed with the construction of the nearby Hoover Dam, which started in 1931. This dam on the Colorado River supported the growth of the city, as it helped solve problems with the supply of water and energy in the desert climate. Annual rainfalls reach about 110 mm only.
Additional support for the development of Las Vegas came from the growing tourism sector, which is based mostly on the increasingly important casinos and the vicinity of the famous national parks around the Grand Canyon.
The consequence was a rapid population increase, the population almost quadrupled within the 40 years between 1980 and 2020:
| Year | Population |
| 1950 | 24,600 |
| 1980 | 164,700 |
| 1990 | 258,300 |
| 2000 | 478,400 |
| 2010 | 583,800 |
| 2020 | 641,900 |
This population increase is reflected in the time series of satellite images showing the growth of the area covered by Las Vegas.
However, this growth has led to problems. A massively increasing water use was due both to the growing number of people and to the increasing wealth of the inhabitants, which goes hand in hand with large water consumption per capita.
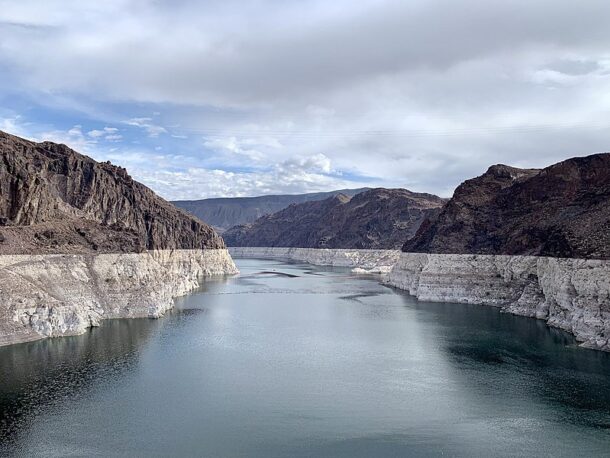
In combination with the growing water consumption, a series of years with little rainfall between 2015 and 2021 has led to a low water level of Lake Mead. This low water level threatens not only the water supply of Las Vegas, but also the energy production by the Hoover Dam, for which a minimum water flow is required.
The water crisis has lead to countermeasures by the communal administration. One of the measures is that watering lawns is prohibited for certain periods of time, additionally water is more and more re-used by returning treated water to Lake Mead. As a consequene the per capita use of water has been reduced by 47% between 2002 and 2020.
Exercises
- Satellite Map:
- Looking at the satellite image maps and move the slider to the left and to the right.
- Which differences can you identify between the satellite images from 1986 and 2020?
- Try to estimate the area of the city in 1990 and in 2020, respectively. By which factor has the area increased?
- How does this relate with the population increase during this time span (see table above)?
- Green areas in the satellite images are covered with vegetation. What types of vegetated areas do you expect in this environment (e.g. pastures, urban green, golf courses, crop fields, …)?
- Take a look at Lake Mead in the east part of the satellite images. Is there a change of the water surface visible? What reasons could lead to this change?
- Think about the role of water for our society. What is it needed for? Where does the water for your home town come from?
- EO Browser:
- Open the EO Browser.
- Find the most recent Sentinel-2 dataset covering the area displayed in the satellite map
- Select a true colour representation
- Can you identify additional, recent changes in the area (focus on the city of Las Vegas and on the water surface of Lake Mead)?