Shrinking water resources
Background
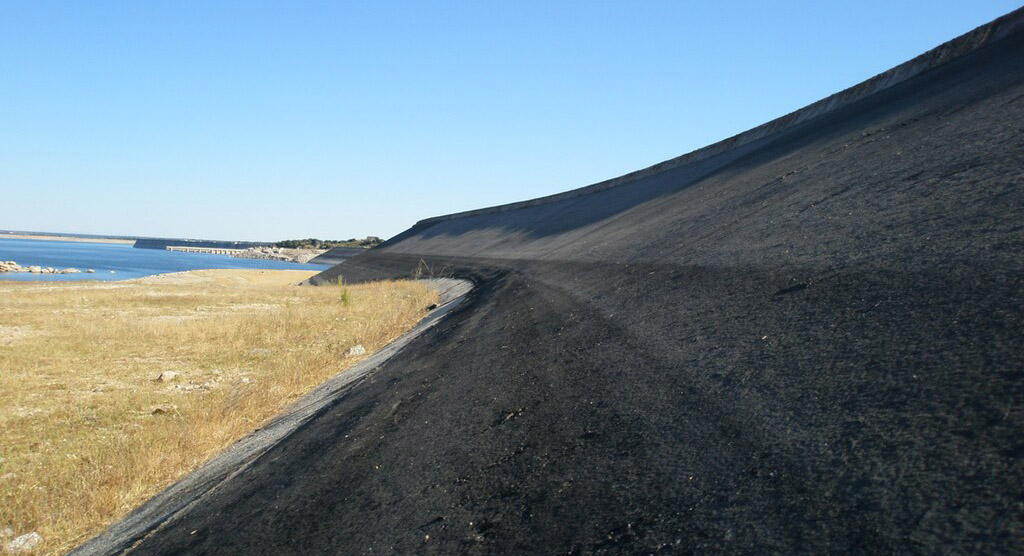
The Almendra Reservoir covers an area of more than 8,000 hectares, making it one of the largest reservoirs of Spain. It is located near the Spanish-Portuguese border in the region of Castilla y León and is a lifeline for the local agriculture sector. It was created between 1963 and 1970 with the construction of the Almendra Dam on the Tormes River. The dam provides water for two tasks: irrigation of agricultural land and producing energy in the Villarino hydropower station, which has an installed capacity of 810 Megawatts.
 Agriculture in this region heavily relies on the Almendra Reservoir for irrigation, with over 50,000 hectares of arable land benefiting from its controlled water release. This sustains the cultivation of various crops despite the aridity of the region, including wheat, barley, sunflowers, and vineyards, contributing significantly to Spain’s agricultural production.
In recent years, climate change has posed challenges to the Almendra Reservoir’s reliability. Rising temperatures and changing precipitation patterns have put pressure on water resources in the area. Sustainable water management practices have become increasingly important to adapt to these changes not only to safeguard the livelihoods of local farmers, but to secure the energy production by the hydropower station, too.
Exercises
- Satellite Map:
- Deselect the layer “Water_2015-2022” and the satellite images from 2015 and 2022 by unticking the respective boxes in the layer selector in the upper left.
- The Open Streetmap (OSM) map remains. Which land cover classes can you identify?
- Add the satellite image from 2015 and zoom in. Which land cover classes can you identify?
- Toggle between the satellite images from 2015 and 2022. Where are the modifications of the landscape most prominent?
- Where can you find an change of the water area?
- Compare this with the layers “Water_2015-2022“. How accurate would you consider this water map derived from satellite data?
- With respect to the water surface, which satellite image is in best agreement with the OSM map? What can this tell us about the age of the data used to derive the OSM map?
- How can the changes in the water surface influence the wildlife in this region?
- How do they affect the people living there? Think about the agriculture and the water supply to citizens.
- Describe the land use types you can see in the region. Is only natural land flooded by the dam?
- EO Browser:
- Open the EO Browser.
- Find the most recent Sentinel-2 dataset covering the area displayed in the satellite map.
- Select a true colour visualisation.
- Comparing with the satellite image from 2022, can you identify additional, recent changes in the area (focus on the water surface)?
- Select the false-colour infrared representation. Can you identify the land-use of the most intensely vegetated areas (represented by bright red colours)?
Links and Sources
| Links:
|