Land use conflicts and deforestation in Amazonia
Background
Rondônia is one of the states of Brazil, located in the southwestern part of the Amazon basin. The state has seen a quick population increase from about 40,000 inhabitants in 1950 to more than 1.8 million in 2021. This development went hand in hand with the change in the vegetation cover. Originally almost 90% of the surface was covered by rainforest, but in the meanwhile it has become one of the best known examples of deforestation in the Amazon basin. In Only about one third of the area is currently covered by forests.
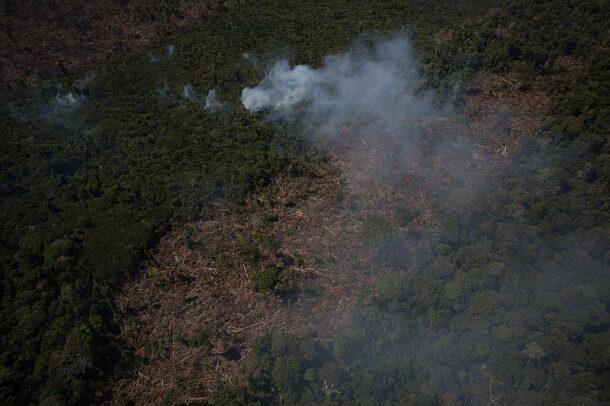
The satellite images show the development around the small town of Campo Novo de Rondônia, which in 2020 had a population of about 14,200. The image series shows how the deforestation is initiated with the construction of roads, along which settlers start to clear the forests in order to gain agricultural land.
Only in the southern part of the area shown in the satellite images forests have remained – this is a part of the Uru-Eu-Uaw-Uaw Indigenous Territory, which was established by the government of Brazil to protect the indigenous population. First contact with one of the tribes living here, the Uru-Eu-Uaw-Uaw people, happened as late as 1981.
Population Data:
| Year | Population |
| 1950 | 39.935 |
| 1960 | 70.232 |
| 1970 | 111.064 |
| 1980 | 491.069 |
| 1996 | 1.229.306 |
| 2010 | 1.562.409 |
| 2021 | 1.815.278 |
(Data: Instituto Brasileiro de Geografia e Estatística (IBGE))
Exercises
- Satellite Map:
- Click on the layer selector icon in the upper right and deselect all layers except the satellite image from 1984. Describe the structures you can identify. Is the area strongly affected by human activities? If so, where?
- Add the satellite image from 2020. Describe the changes you can identify. Which large parts can you separate in the satellite image?
- Add the layer “Indigenous Territory“. How does this layer correspond with your findings?
- Select the satellite image layers one after one, starting with 1984. Describe the changes you can identify with each step. What are the first activities in formerly untouched forest areas, how do the activities continue?
- EO Browser:
- Open the EO Browser.
- Find the most recent Sentinel-2 dataset and display it in natural colours. Is it easy to find cloud-free data of that region? Why/why not?
- Compare this dataset with the 2020 Landsat data in the Satellite Map. Can you identify additional changes? Is the Indigenous Territory still free of changes?
Links and Sources
Links:
|