Traffic hub between the continents
Background
Doha, the capital city of Qatar, located at the northeastern coast of the Arabic Peninsula, has undergone a remarkable transformation over the years. This bustling metropolis has made progress on multiple fronts, shaping its infrastructure in distinctive ways. The population has tripled during the last 20 years and is now about 1 million (2022). Satellite imagery provides a unique perspective on Doha’s development. These images capture the city’s urban growth, infrastructure projects, and environmental changes.
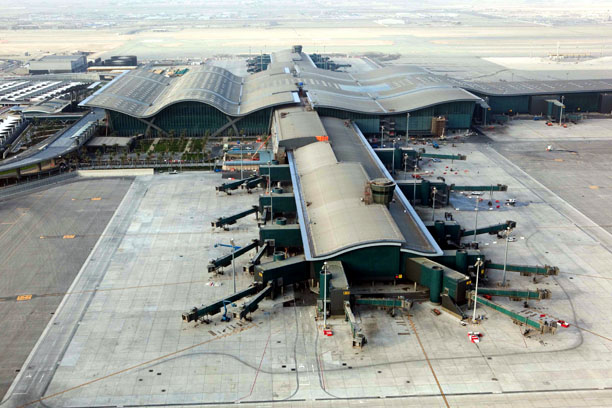 Hamad International Airport is one of the key factors of the development of the city. In 2014 it has replaced Doha International Airport and has become a key global travel hub, connecting the city to the world and facilitating economic expansion. With more than 35 million passengers (2022) this airport is among the 30 busiest airports in the world.
As the satellite images show, the development of the city went hand in hand with a transformation of Doha’s coastline. The city’s expansion into the sea has given rise to new islands and waterfront developments, reshaping the city’s skyline and creating new coastal communities.
Doha gained global recognition when it won the bid to host the 2022 FIFA World Cup. In preparation for the event, the city underwent a major overhaul. Despite problems with the desert climate, state-of-the-art stadiums, transportation networks, and fan zones were constructed, ushering in economic growth and establishing Doha as a hub for international sports.
Exercises
- Satellite Map:
- Toggle between the satellite images from 1988 and 2023 by ticking and unticking the 2023 image.
- Looking at the satellite image maps, estimate the area of the city in 1988 and in 2023, respectively.
- By which factor has the area increased?
- Try to identify the areas where the city has changed most. Put a special focus on changes of the coastline. Where have artificial areas been created by land reclamation?
- Add the water layers from 1988 and 2023, respectively, and compare with your previous findings.
- Using the 2023 satellite image, try to identify the location of the new airport and try to estimate the area covered by it.
- EO Browser:
- Open EO Browser.
- Find the most recent Sentinel-2 dataset covering the area displayed in the satellite map.
- Select a true colour representation.
- Can you identify additional, recent changes in the area (check e.g. the coastline)?
Links and Sources
| Links:
|